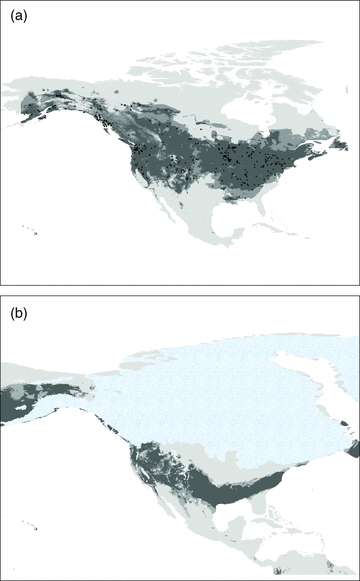
Figure 5.

Environmental niche models of: (A) The present distribution of M. lucifugus based on 360 known occurrence records; and (B) A projection of suitable habitat for the species during the last glacial maximum (18 kya). Presence localities are shown as dark triangles. The darkness of shading indicates the relative suitability: light gray is unsuitable, intermediate represents the minimum training presence threshold, and dark gray represents the more conservative fixed cumulative value 10 threshold. The stippled area in (B) represents the ice extent at the LGM (data from Dyke, 2004).
