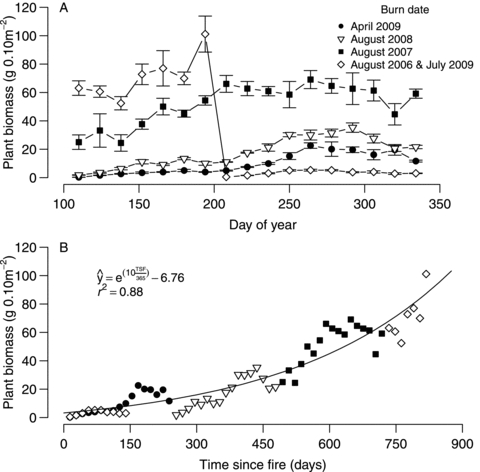
Figure 4.

Aboveground plant biomass (g 0.10 m−2) of tallgrass prairie vegetation from April to December 2009 at the Oklahoma State University Research Range, OK, USA. Symbols are means (n= 4) representing patches that vary in the amount of time since fire; error bars are one standard error. (A) Aboveground plant biomass shown by day of year. (B) Aboveground plant biomass as a function of time since fire (days).
