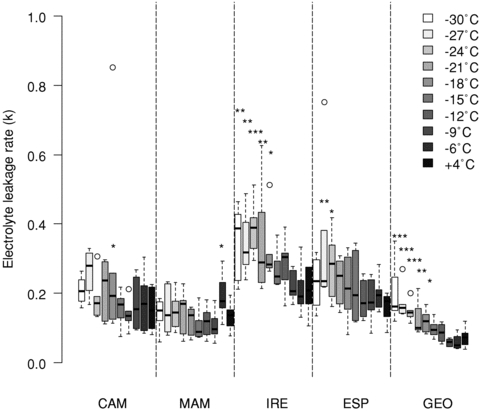
Figure 4.

Electrolyte leakage rate k for the Rhododendron taxa at 10 different temperature levels. CAM = North American R. catawbiense; MAM = North American R. maximum; IRE = invasive Irish R. ponticum; ESP = native Spanish R. ponticum; GEO = native Georgian R. ponticum. Stars indicate significant differences according to contrasts between the control temperature of +4°C versus all other temperatures within each taxon. *P < 0.05, **P <0.01, ***P < 0.001.
