
Figure 2.
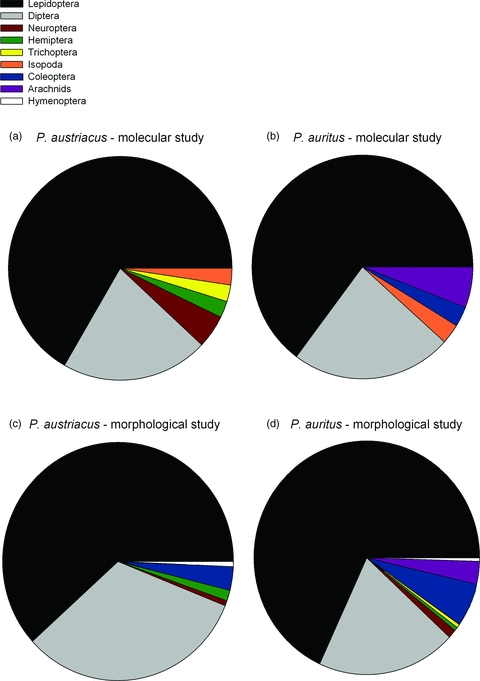
Pie charts showing the diet composition at the ordinal level of the two bat species in southern England based on molecular ([A] Plecotus austriacus [N = 28]; [B] P. auritus [N = 24]) and morphological diet analyses ([C] P. austriacus from the Devon colony [N = 170]; [D] P. auritus adapted from Hollyfield 1993 [N = 240]). The proportion of prey orders in the diet is presented as percent frequency of occurrence (%FO).