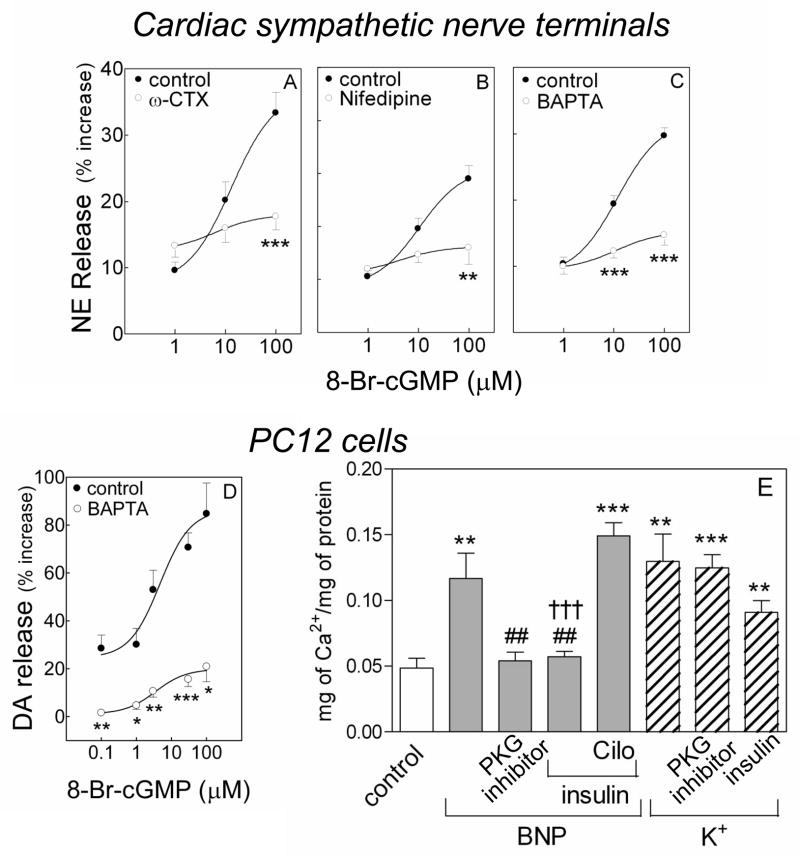
Figure 3.
Calcium dependence of the catecholamine-releasing effect of cGMP. A–C. release of endogenous NE from guinea pig heart synaptosomes by 8-Br-cGMP (1 to 100 μM) in the absence (control) and presence of the N- and L-type Ca2+ channel blockers ω-CTX (100 nM) and nifedipine (5 μM), and of the intracellular Ca2+ chelator BAPTA (10 μM). D. DA release from NGF-differentiated PC12 cells in the absence (control) and presence of BAPTA (10 μM). Points are mean increases in NE and DA release above basal level (± SEM; n=12 for A and B; n=8 for C; n=4–15 for D). Basal NE and DA levels were 1.42 ± 0.05 and 6.94 ± 0.92 pmol/mg protein, n=32 and 20, respectively. *, P<0.05, **, P<0.01 and ***, P<0.001 from corresponding control point by unpaired t-test. E. Intracellular Ca2+ content of NGF-differentiated PC12 cells treated with Na-Ringer, K+ (100 mM) or BNP (100 nM) in the absence or presence of PKG inhibitor (Rp-8-Br-cGMPS; 0.5 μM) or the PDE3 activator insulin (100 nM), with or without the PDE3 inhibitor cilostamide (10 μM; Cilo). Bars represent mean quantitative values (±SEM; n=8–12 for E). **, P<0.01 and ***, P<0.0001 from control, ##, P<0.01 from BNP and †††, P<0.0001 from the combination of BNP, insulin and cilostamide by unpaired t-test.

