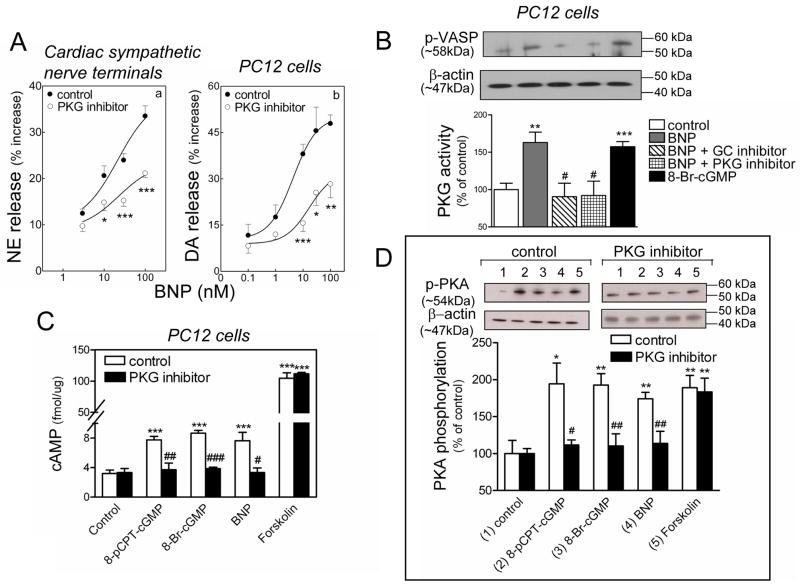
Figure 5.
PKG dependence of the catecholamine-releasing effect of BNP. A. Concentration-response curves for the NE- and DA-releasing effect of BNP (0.1–100 nM) in synaptosomes isolated from guinea pig hearts (panel a) and NGF-differentiated PC12 cells (panel b) in the absence (control) or presence of the PKG inhibitor Rp-8-Br-cGMPS (30 and 0.5 μM in panel a and b, respectively). Points are means (± SEM; a, n=10–16; b, n=7–11). *, ** and ***, P<0.05, P<0.01 and P<0.001 respectively, from corresponding control point by unpaired t-test. Basal NE and DA levels were 1.35 ± 0.02 and 6.98 ± 0.81 pmol/mg protein, n=22 and 10, respectively. B. PKG activity in PC12 cells in response to BNP (100 nM) in the absence (control) or presence of the guanylyl cyclase inhibitor (LY83583; 10 μM) or the PKG inhibitor (Rp-8-Br-cGMPS; 0.5 μM), and in response to 8-Br-cGMP (1μM). Upper strip, representative immunoblot of PC12 cell lysate probed with anti-phosphorylated VASP (a major substrate for PKG) antibody. Lower strip, same immunoblot probed with anti-β-actin antibody. Columns (means ± SEM; n = 4–9) represent quantitative data. ** and ***, P=0.0012 and P=0.0004 respectively, from control by unpaired t-test. #, P<0.05 from BNP by unpaired t-test. C. intracellular levels of cAMP in PC12 cells in response to BNP (100 nM) and cGMP analogs (8-pCPT-cGMP; 3 μM, 8-Br-cGMP; 1 μM) in the absence or presence of PKG inhibitor (Rp-8-Br-cGMPS; 0.5 μM); positive control: forskolin (10 μM). Columns are means ± SEM (n = 4–11). ***, P<0.001 from control by unpaired t-test. #, ## and ###, P=0.0302, P=0.0016 and P<0.0001 respectively, from respective controls by unpaired t-test. D. PKA activity in PC12 cells in response to BNP (100 nM), cGMP analogs (8-pCPT-cGMP; 3 μM, 8-Br-cGMP; 1 μM) or forskolin (10 μM) in the absence or presence of PKG inhibitor (Rp-8-Br-cGMPS; 0.5 μM). Upper strips, representative immunoblots of PC12 cell lysate probed with anti-phosphorylated PKA antibody. Lower strips, same immunoblots probed with anti-β-actin antibody. Columns (means ± SEM, n = 5–9) represent quantitative data. * and ***, P=0.0107 and P<0.01 from control by unpaired t-test. # and ##, P=0.0481, and P<0.01 respectively, from own controls by unpaired t-test.

