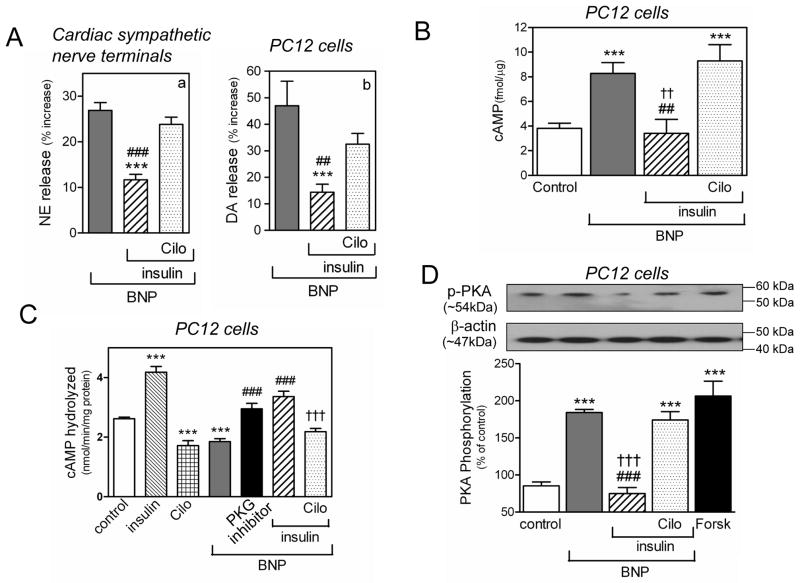
Figure 6.
The catecholamine-releasing effect of BNP depends on PDE3 inhibition. A. PDE3 activation with insulin (30 nM and 100 nM in synaptosomes and PC12 cells, respectively) attenuates BNP (100 nM)-induced increase in NE and DA in synaptosomes isolated from guinea pig hearts (panel a) and NGF-differentiated PC12 cells (panel b). Pretreatment with the PDE3 inhibitor cilostamide (10 μM; Cilo) prevents the insulin-mediated attenuation of the NE-releasing effect of BNP. Columns are means (± SEM; a, n=12–16; b, n=10–17). ***, P<0.001 from BNP, ## and ###, P=0.0011 and P<0.0001 respectively, from the combination of BNP, insulin and cilostamide, by unpaired t-test. Basal NE and DA levels were 1.35 ± 0.02 and 6.44 ± 0.43 pmol/mg protein, n=22 and 10, respectively. B. intracellular levels of cAMP in PC12 cells in response to BNP (100 nM) in the absence or presence of insulin (100 nM). Pretreatment with cilostamide (10 μM; Cilo) prevents the insulin-mediated attenuation of the cAMP-enhancing effect of BNP. Columns are means ± SEM (n = 9–26). ***, P<0.0001 from control; ##, P=0.0059 from BNP; ††, P=0.0027 from the combination of BNP, insulin and cilostamide, by unpaired t-test. C. BNP (100 nM) decreases PDE3 activity (expressed as the rate of cAMP hydrolyzed in terms of nmol/minute/mg protein) in PC12 cells, PKG inhibitor (Rp-8-Br-cGMPS; 0.5 μM) blocks the PDE3-inhibiting effect of BNP. Insulin (100 nM) and cilostamide (10 μM) alone are controls. Combination of BNP (100 nM) and insulin (100 nM) blocks the PDE3-inhibiting effect of BNP, pretreatment with cilostamide (10 μM) restores the PDE3-inhibiting effect of BNP. Columns are means (± SEM; n=7–10). ***, P<0.0001 from control; ###, P<0.0001 from BNP; †††, P=0.0001 from the combination of BNP and insulin, by unpaired t-test. D. PKA activity in PC12 cells in response to BNP (100 nM) in the absence or presence of insulin (100 nM). Pretreatment with cilostamide (10 μM) prevents the insulin-mediated attenuation of the PKA-enhancing effect of BNP. Forskolin (10 μM) is the positive control. Upper strip, representative immunoblot of PC12 cell lysate probed with anti-phosphorylated PKA antibody. Lower strip, same immunoblot probed with anti-β-actin antibody. Columns (means ± SEM, n = 5–9) represent quantitative data. ***, P<0.0001 from control; ###, P<0.0001 from BNP; †††, P<0.0001 from the combination of BNP, insulin and cilostamide, by unpaired t-test.

