
Fig. 1.
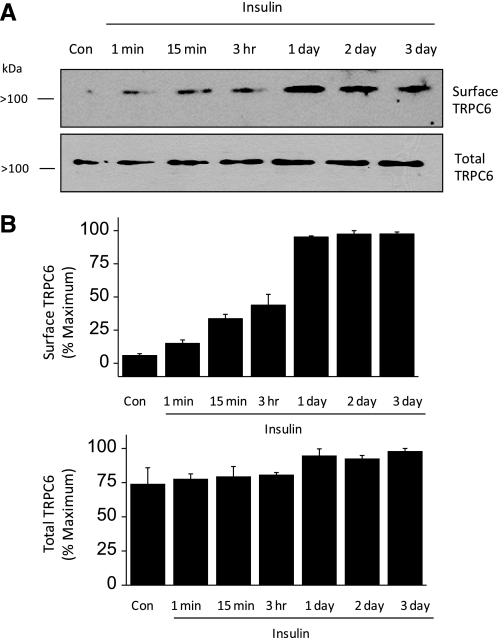
Insulin increases the steady-state surface expression of TRPC6 in differentiated cells of an immortalized podocyte cell line. A: representative cell surface biotinylation assay showing surface and total expression of TRPC6 as indicated after exposing podocytes to insulin for the durations indicated. Biotinylated (surface) and total cellular proteins were quantified by immunoblot analysis. In this experiment, note increase in surface expression of TRPC6 with insulin exposures of 1 and 15 min, with larger effects seen after 1 day of insulin treatment. In this and subsequent figures, molecular weights are shown to the left of each blot. B: bar graphs showing densitometric analysis of 3 repetitions of this experiment. Bars denote mean signal intensity from immunoblot for surface TRPC6 (top) and total TRPC6 (bottom), and error bars denote SE.