
Fig. 3.
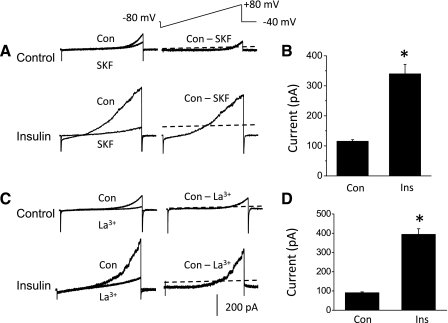
Insulin increases cationic currents in podocytes. A: currents evoked during voltage ramps in control podocytes (top traces) and in podocytes treated with 100 nM insulin for 12 h (bottom traces), as indicated. Superimposed traces to the left are from the same cell before and after bath application of 10 μM SKF96365. The traces on the right show SKF96365-sensitive current calculated by digital subtraction. The dotted lines running through the subtracted traces denote the zero-current level. Note that SKF96365-sensitive currents are much larger in cells treated with insulin. B: summary of results of several repetitions of the experiment shown in A. Ordinate is the mean SKF96365-sensitive current measured at +80 mV. *Significant (P < 0.0001, Student's unpaired t-test) increase in current after insulin treatment (n = 10 cells in each group). C: as in A except that currents in control or insulin-treated cells were blocked by bath superfusion of 100 μM La3+. D: summary of several repetitions of the experiment shown in C, showing that La3+-sensitive currents are significantly larger in insulin-treated cells (P < 0.001, Student's unpaired t-test, n = 5 cells in each group).