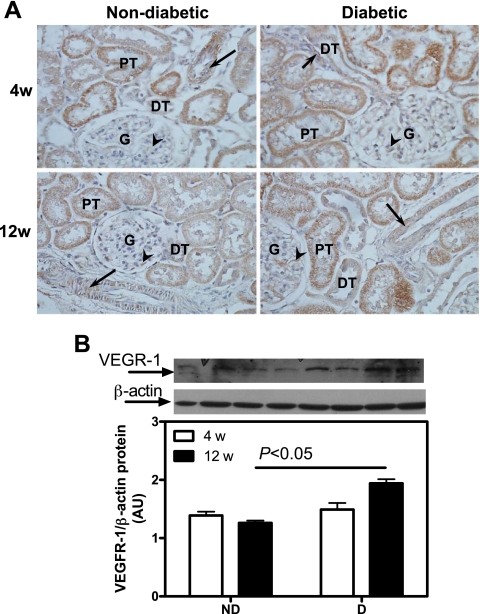
Fig. 6.

Renal cortical VEGFR1 protein expression. A: VEGFR1 immunolocalization (brown staining). Original magnification ×400. B: VEGFR1 protein expression. Top: representative immunoblot of VEGFR1 protein expression. Bottom: densitometric scans in ROD expressed as a ratio of VEGFR1/β-actin. Data are expressed as means ± SE. G, glomerulus; arrows, vascular smooth muscle cells; arrowheads, endothelial cells.
