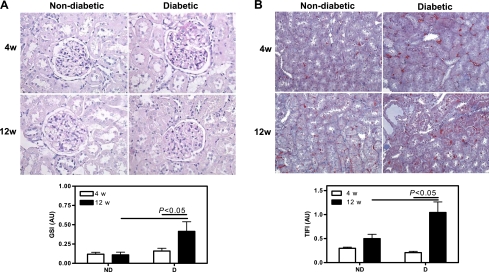
Fig. 8.

Renal pathology. A: representative PAS-stained section and quantification of glomerulosclerosis. B: representative Mason's trichrome-stained section and quantification of tubulointerstitial fibrosis. Original magnification ×400. Data are expressed as means ± SE.
