
Fig. 1.
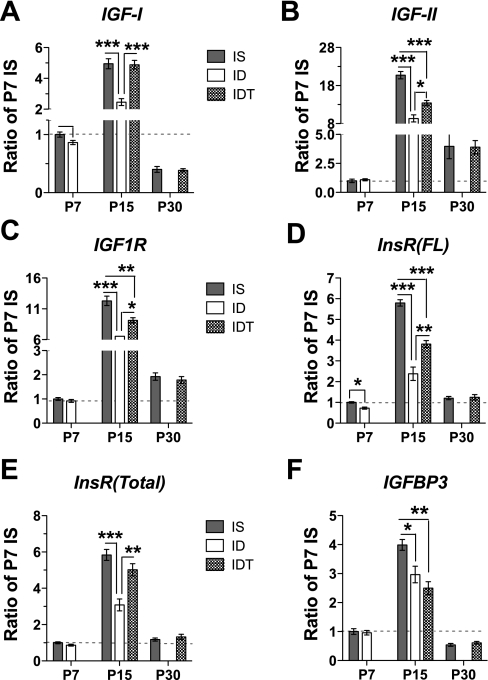
Quantitative PCR analysis of hippocampal insulin-like growth factor (IGF) and IGF receptors (IFG1R). Transcript levels were measured from the hippocampus of control [iron sufficient (IS)], untreated [iron deficient (ID)], and treated [ID treated with iron (IDT)] groups for IGF-I (A), IGF-II (B), IGF1R (C), insulin receptor full-length variant [InsR(FL)] (D), total insulin receptor [InsR(Total)] (E), and IGF-binding protein (IGFBP) 3 (F). P, postnatal day. Values are means ± SE; n = 4–9 rats/group. *P < 0.05, **P < 0.01, and ***P < 0.001.