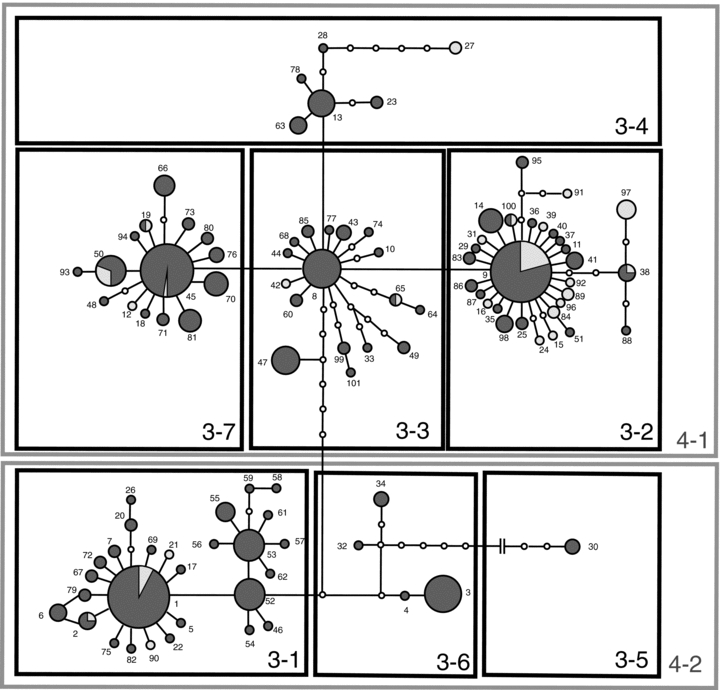
Figure 3.

Haplotype network of combined data showing third- and fourth-level haplogroups with group numbers. Small numbers refer to haplotypes; size of haplotype is proportional to number of individuals. Each line, regardless of its length, is a single mutational step, and an open circle is a hypothetical haplotype. Branch between haplogroups 3–5 and 3–6 includes 15 mutational steps (cut for the figure). Hosts (macrogyne queen or worker) in dark gray and parasites (microgyne queen) in light gray.
