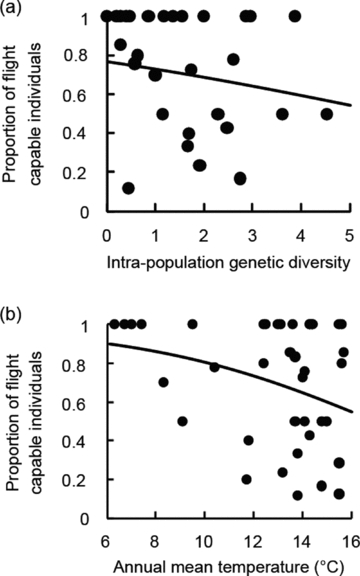
Figure 6.

(a) Relationship between genetic diversity (average genetic distances between individuals) and the proportion of beetles with flight muscles in each population. Regression: y = exp(−0.043x+ 0.771)/{1 + exp(−0.043x+ 0.771)}. (b) Relationship between annual mean temperature and the proportion of beetles with flight muscles in each population. Regression: y = exp(−0.020x+ 3.467)/{1 + exp(−0.020x+ 3.467)}.
