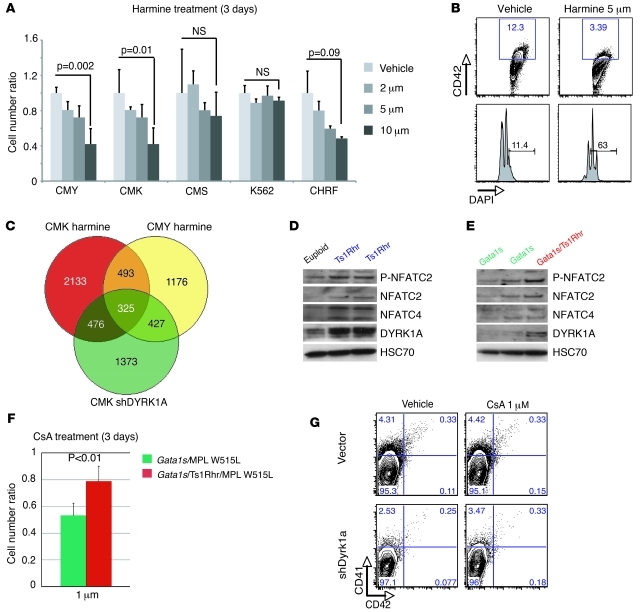
Figure 7. DYRK1A dosage imbalance is correlated with NFAT pathway dysregulation in human and murine primary cells.
(A) Ratio of live cells treated with serial dilution of the Harmine inhibitor at 3 days (n = 3 per group) normalized on untreated cells. Mean ± SD. (B) Representative FACS plots, showing the effect of 5 μM harmine on a 3-day TPA-induced megakaryocytic differentiation of CMY. (C) Venn diagram showing the number of common genes dysregulated between treated or infected CMK and CMY cells during TPA-induced megakaryocytic differentiation. (D and E) Representative Western blots of DYRK1A, NFATC2, phospho-NFATC2 (P-NFATC2), and NFATC4 expression (D) in CD41-enriched spleen cells from euploid mice compared with that in Ts1Rhr mice (n = 2) and (E) in Gata1s mice (n = 2) compared with that in Gata1s/Ts1Rhr mice. (F) Gata1s/Ts1Rhr/MPL W515L triple mutant cells are less sensitive to the NFAT/calcineurin inhibitor cyclosporine A (CsA) than the non-trisomic Gata1s/MPL W515L cells in liquid culture. Mean ± SD (n = 5 per group). (G) Flow cytometry analysis of CD41 and CD42 populations derived from Ts1Rhr bone marrow progenitors infected with control or DYRK1A shRNA and treated for 3 days with cyclosporine A or vehicle. Percentages of live cells are indicated.

