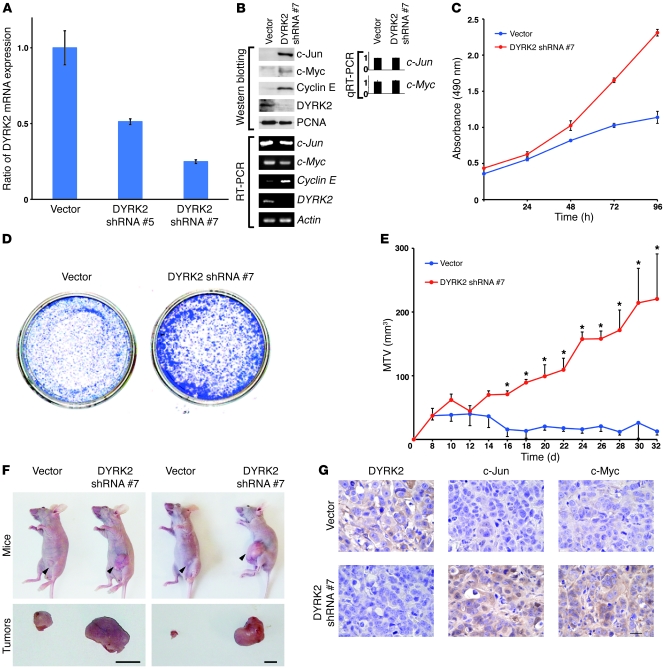
Figure 5. Stable knockdown of DYRK2 elevates tumor growth in vitro and in vivo.
(A) MCF-7 cells were transfected with pSuper vector or pSuper-DYRK2 shRNA. To isolate stable shRNA-expressing cells, transfected cells were selected with puromycin. Knockdown efficiency of DYRK2 was monitored by quantitative RT-PCR. (B) Lysates form MCF-7 cells stably expressing vector (vector) or pSuper DYRK2 shRNA (DYRK2 shRNA #7) were analyzed by immunoblotting with indicated antibodies. Total RNAs were analyzed by RT-PCR. The result of quantitative RT-PCR was normalized for the level of Actin and represents the relative fold induction compared with control sample. The data were evaluated from 3 independent experiments, each performed in triplicate. (C and D) Cell growth was analyzed by the MTS assay (C) or the colony formation assay (D). (E and F) Transduced MCF-7 cells with 50% matrigel were inoculated into the opening of the lactiferous duct in the abdominal mammary gland in BALB/c nu/nu mice implanted with 17β-estradiol tablets. Tumor size was measured using calipers (n = 3). Data (maximum tumor volume [MTV]) indicate mean ± SD (E). *P < 0.05. Representative pictures of tumor-bearing nude mice (upper panels) and tumors (lower panels), which were taken 10 weeks after inoculation (F). Arrowheads indicate inoculated tumors. Scale bar: 10 mm. (G) Enucleated tumors were subjected to immunostaining with anti-DYRK2, anti–c-Jun, or anti–c-Myc. Scale bar: 50 μm.

