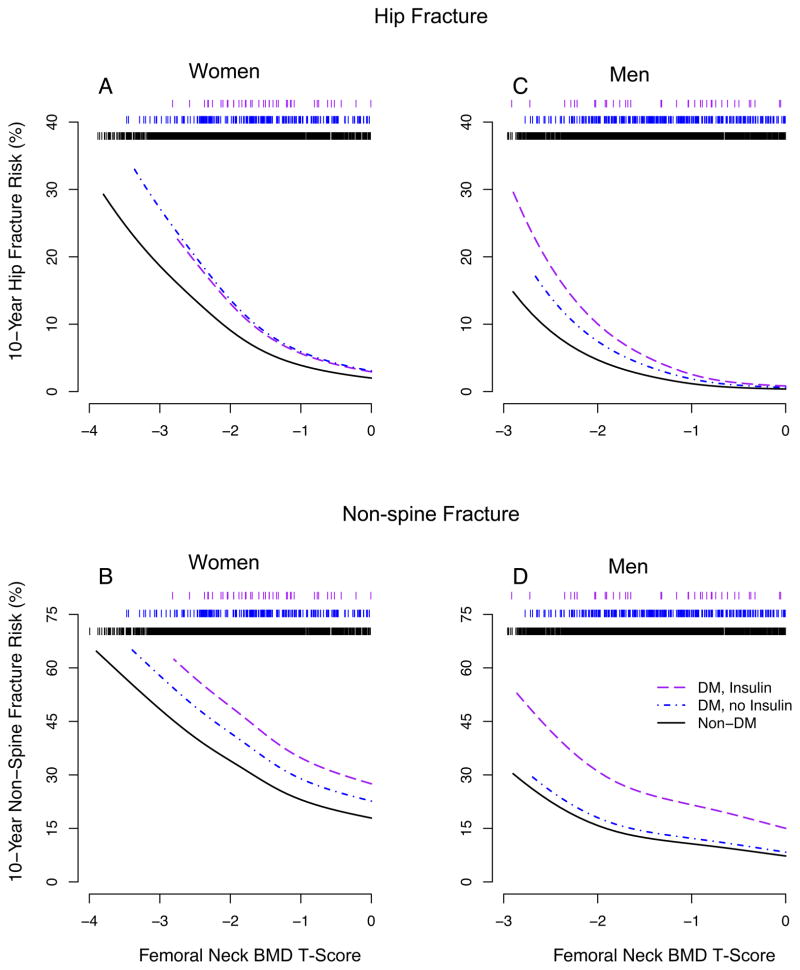
Figure 1. Femoral neck BMD T-score and 10-year fracture risk at age 75 by diabetes and insulin use status.
Ten-year cumulative risks were estimated using the Cox model baseline survival function, evaluated at 10 years, raised to the power of the relative hazard for each combination of diabetes group and T-score at age 75 years. Rug plot at top of figures indicates number of participants (73–77 years old) at each level of T-score. A (N=41, 205, 2604); B (N=41, 196, 2468); C, D (N=40, 306, 1698).

