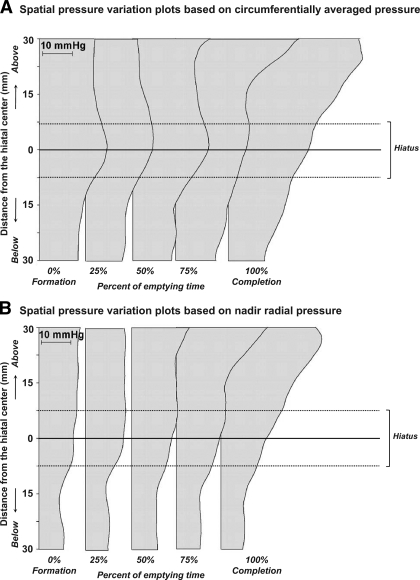
Fig. 5.
Spatial pressure variation plots of circumferentially averaged (A) and nadir radial pressure (B) at landmark times of ampullary emptying. The median pressure along the hiatal center (solid line at 0 mm) was greater when based on circumferential averaging than nadir radial pressures, creating an artifactual focal high pressure at the hiatal center that appeared to interrupt an otherwise favorable flow-permissive gradient.

