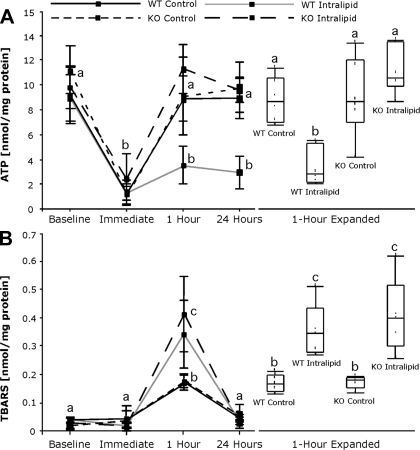
Fig. 5.
The effect of UCP2 deficiency on ATP concentrations and lipid peroxidation following hypoxia/reoxygenation in steatotic hepatocytes. At the end of the initial 24-h incubation (baseline), at the end of hypoxia (immediate), and 1 and 24 h after reoxygenation, cellular ATP concentrations were measured by chemiluminescent assay, and lipid peroxidation was monitored by thiobarbituric acid reactive substances (TBARS) measurement. A: levels of ATP are plotted over time on the line graph as means + SD, and the 1-h time point is expanded on the right in box plot format. n = 6/group. B: lipid peroxidation was analyzed by TBARS measurement, and illustrated as in A. n = 3/group (baseline) and 5/group (all other points); a,b,cmeans with different superscripts are significantly different; P < 0.05.

