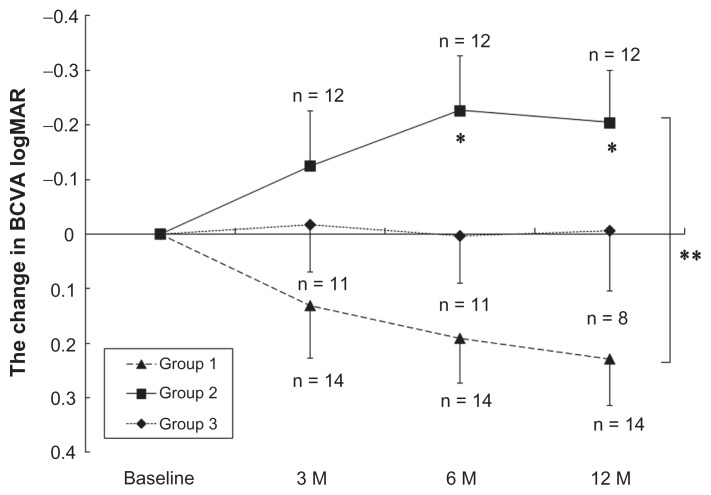
Figure 1.
Changes in the BCVA of RAP patients after PDT, STA + PDT, and IVR + PDT. The BCVA was determined using the Landolt C chart, and is presented as decimal visual acuities. Triangles with dashed line: PDT (Group 1); squares with solid line: STA + PDT (Group 2); diamonds with dot line: IVR + PDT (Group 3).
Notes: Values represent mean ± SEM; *P < 0.05 compared to baseline; **P < 0.05 between Group 1 and Group 2.
Abbreviations: BCVA, best corrected visual acuity; IVR, intravitreal injections of ranibizumab; RAP, retinal angiomatous proliferation; PDT, photodynamic therapy, STA, subtenon injections of triamcinolone acetonide.

