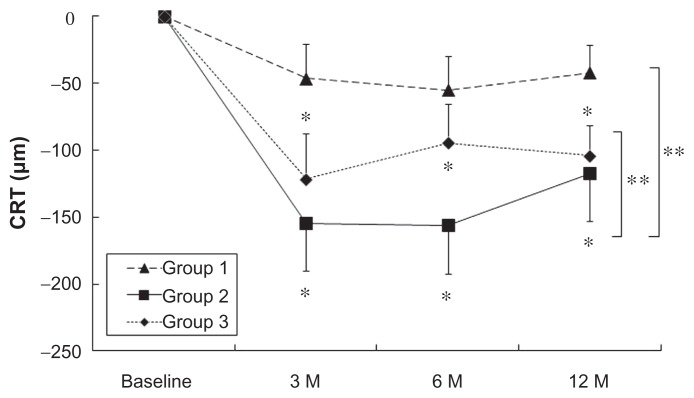
Figure 2.
Changes in the CRT of RAP patients after PDT, STA + PDT, and IVR + PDT. Triangles with dashed line: PDT (Group 1); squares with solid line: STA + PDT (Group 2); diamonds with dot line: IVR + PDT (Group 3).
Notes: Values represent mean ± SEM. *P < 0.05. **P < 0.05 between Group 1 and Group 2, or between Group 2 and Group 3.
Abbreviations: CRT, central retinal thickness; IVR, intravitreal injections of ranibizumab; RAP, retinal angiomatous proliferation; PDT, photodynamic therapy, STA, subtenon injections of triamcinolone acetonide.

