
Figure 1.
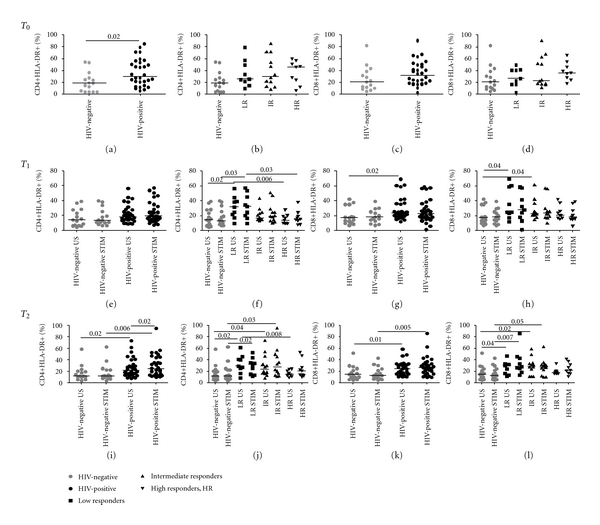
HLA-DR-expressing CD4+/CD8+ T-cells in HIV-negative and HIV-positive patients prior to and following LPS stimulation. HLA-DR expression was measured on freshly ficoll-separated CD4+ and CD8+ T-cells at baseline (T0, top), and following 24- (T1, middle) and 48-hour (T2, bottom) LPS stimulation. PBMCs were cultured in medium alone (unstimulated, US) or in medium with 20 ng/mL LPS (stimulated, STIM). At T0, HIV-positive individuals displayed higher HLA-DR+CD4+ (P = 0.02, (a)) and HLA-DR+CD8+ proportions (c), with no differences amongst HIV-positive subgroups ((b) and (d)). At T1, HIV-positive patients maintained increased HLA-DR+CD4+ (e) and CD8+ cells (g); significantly higher HLA-DR+CD4+ levels were detected in LR versus HR and negative controls (P = 0.03 for both comparisons, (f)). At T2, HIV-infected individuals displayed significantly higher HLA-DR+CD4+ (P = 0.006, (i)) and CD8+ cells compared to controls (P = 0.005, (k)). Following stimulation, significantly greater proportions of HLA-DR-expressing CD4+ were measured in LR (P = 0.02, (j)) and IR (P = 0.03, (j)) compared to controls. Comparable results were detected in the CD8+ compartment upon LPS stimulation (LR versus HIV-negative, P = 0.007, (l); IR versus HIV-negative, P = 0.05, (l)). P values in the results section refer to stimulated samples only.