
Figure 3.
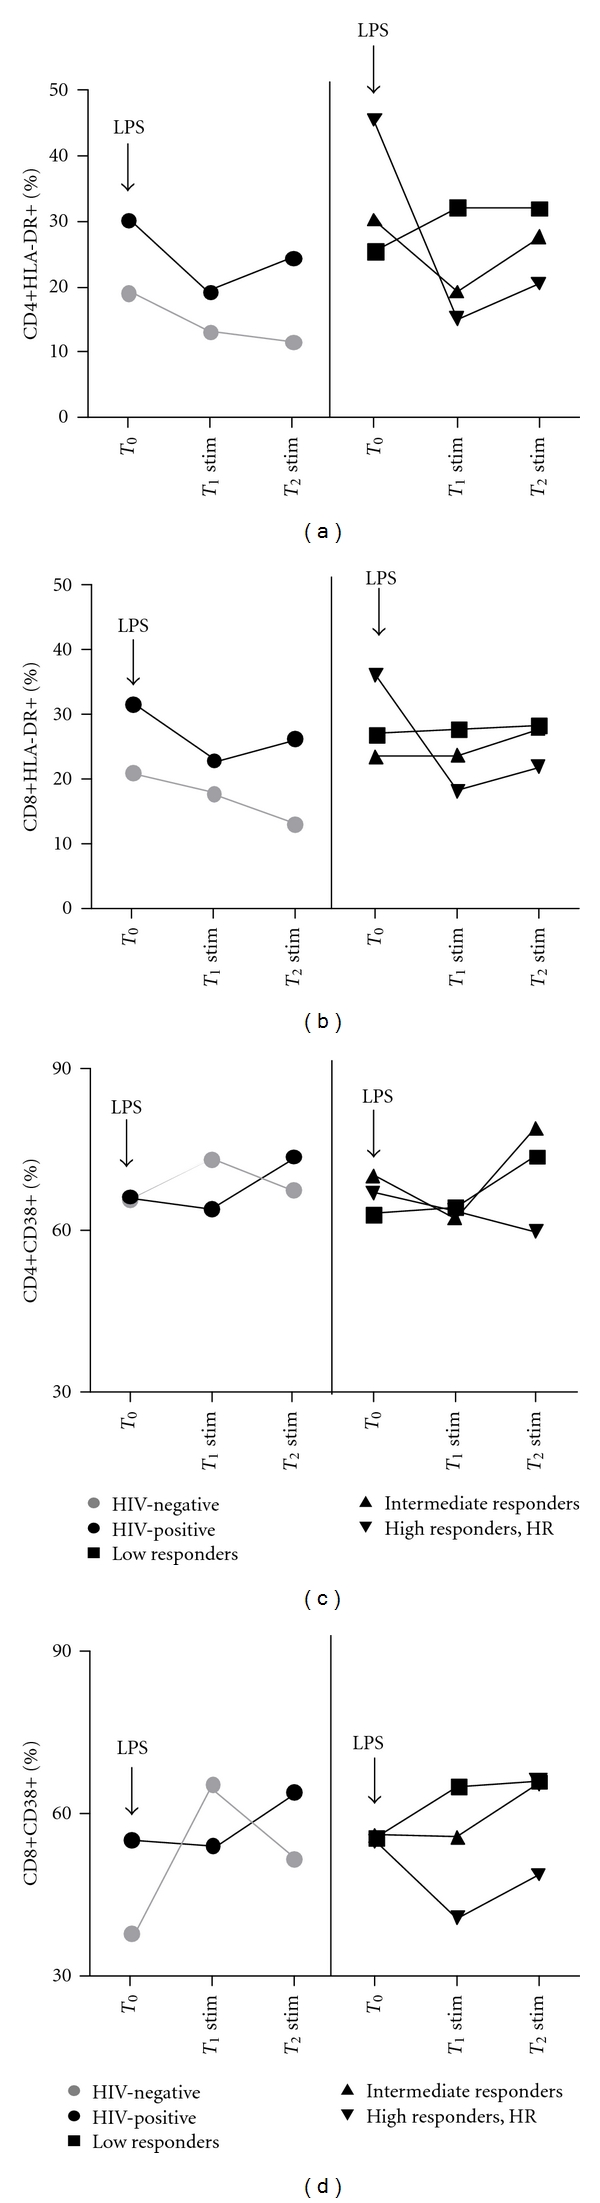
Time course representation of the effect of LPS on HLA-DR and CD38 expression on CD4+ and CD8+ T-cells. Median HLA-DR ((a) and (b)) and CD38 ((c) and (d)) expression on CD4+ and CD8+ T-cells in HIV-positive and HIV-negative individuals (left portion of graphs) and in HIV-infected subjects with different immunological outcome in course of HAART (right portion of graphs) at baseline (T0) and following LPS stimulation (T1 stim, T2 stim).