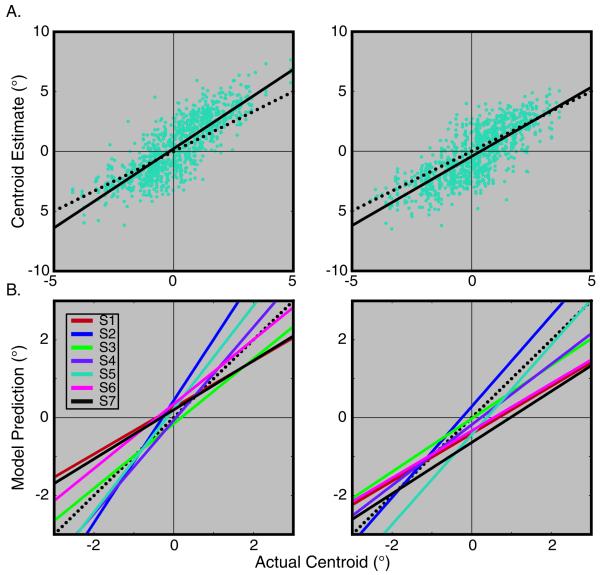
Figure 5.
Late Bias model. (A) Centroid estimates of a single subject (S5) plotted against the actual centroid position for the horizontal (Left panel) and vertical (Right panel) dimensions. Fitted Late Bias linear regression model (solid line). This subject shows a foveofugal bias (i.e., β > 1). (B) Fitted Late Bias model for all subjects along the horizontal (Left panel) and vertical (Right panel) dimensions. Each solid line depicts the estimated behavioral response as a function of the actual centroid position for one subject using the fitted parameters from the Late Bias model. Four subjects show a significant foveopetal bias in both dimensions (red, black, green, pink), two subjects show a significant foveofugal bias in both dimensions (dark and light blue), and one subject shows a foveofugal bias along the horizontal dimension and a foveopetal bias along the vertical dimension (purple) [95% CI Method]. Unity (dotted) line shows where actual centroid equals the centroid estimate.

