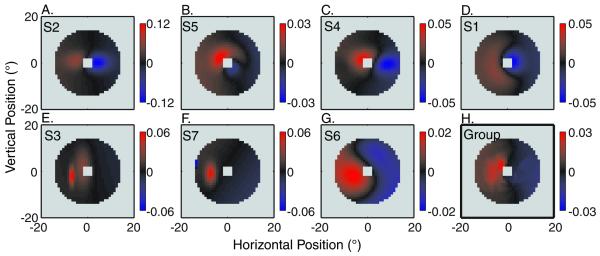
Figure 8.
Attentional Weight Maps (Experiment 1. Unilateral-Cue conditions). Attentional weights were determined as the difference maps between the Left-Cue and Right-Cue condition in the Weighted Sum model (Equation 5). Red indicates a location where the Left-Cue weight was higher and blue indicates a location where the Right-Cue weight was higher. Gray regions depict areas without any dot positions. (A-G) Subject specific weight difference maps ordered the same as in Figure 7. In all cases, weights were enhanced in one or both of the visual fields that contained the exogenous cue. The local structure of these differences varied considerably across subjects. (H) Group weight difference map. Obtained using the median of each weight difference at a specific spatial position across subjects.

