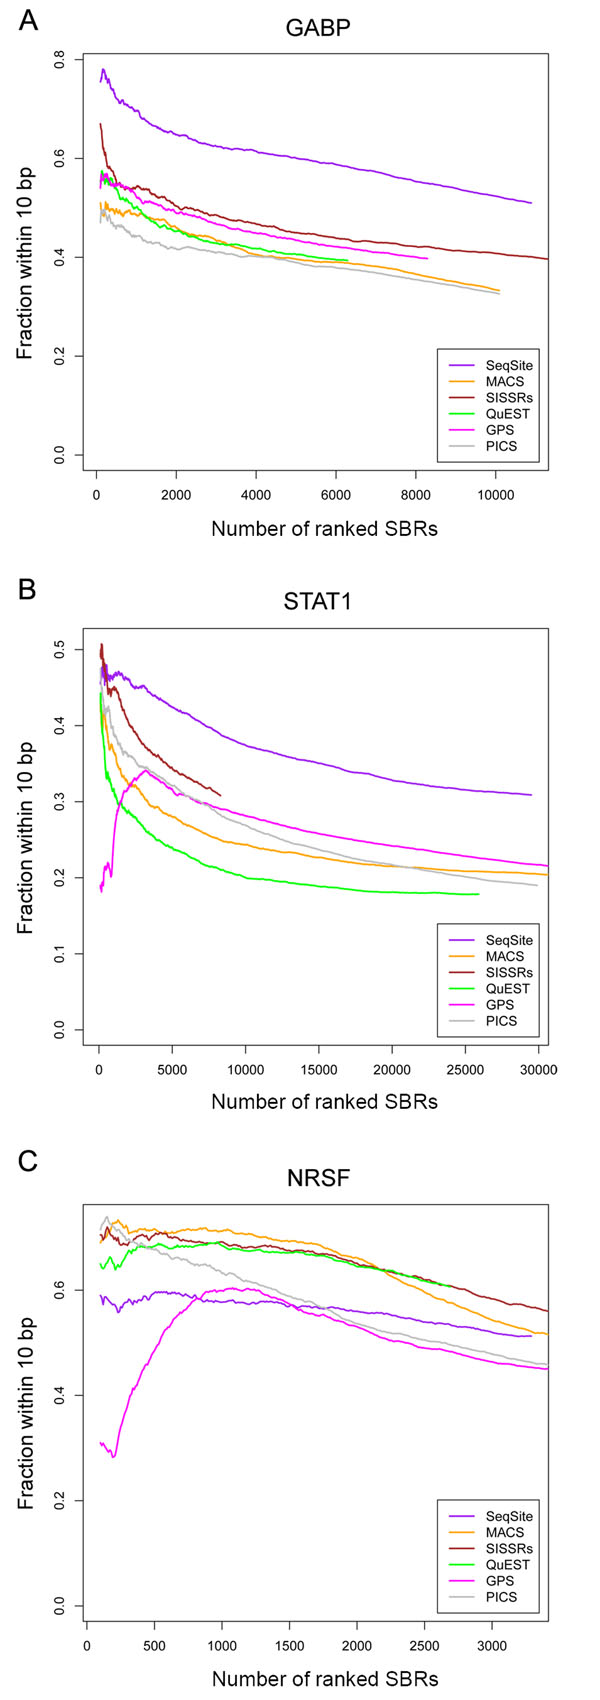
Figure 6.
Resolution of binding sites detected with the six methods. The binding site identification resolution shown here is indexed by the fraction of SBRs with at least one binding site that is within 10 bp from an associated motif center. The three datasets are the GABP (A), STAT1 (B), and NRSF (C) ChIP-seq datasets. The experimented methods are: SeqSite (purple curve), MACS (orange), SISSRs (brown), QuEST (green), GPS (magenta), and PICS (grey).

