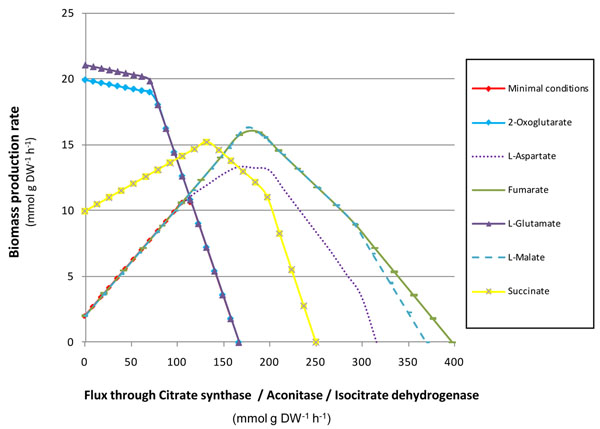
Figure 6.
Sensitivity analysis for the first three reactions of the TCA cycle. Biomass production rates (mmol g DW-1 h-1) by the Bge strain model were measured under different metabolic environments (minimal conditions or the uptake of the indicated metabolites, see inset) and diverse reaction flux through the first enzymatic steps of the TCA cycle: citrate synthase, aconitase and isocitrate dehydrogenase.

