
Figure 3.
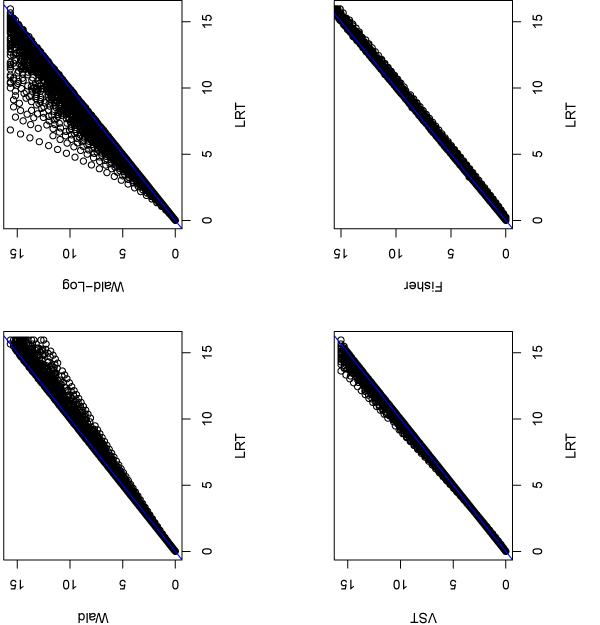
P-values for the real RNA-seq data from different methods. Compare p-values (-log10 scale) obtained from other methods with those from LRT for the 15227 genes whose average counts per lane are at least one for each sample.
Official websites use .gov
A
.gov website belongs to an official
government organization in the United States.
Secure .gov websites use HTTPS
A lock (
) or https:// means you've safely
connected to the .gov website. Share sensitive
information only on official, secure websites.
P-values for the real RNA-seq data from different methods. Compare p-values (-log10 scale) obtained from other methods with those from LRT for the 15227 genes whose average counts per lane are at least one for each sample.