
Figure 4.
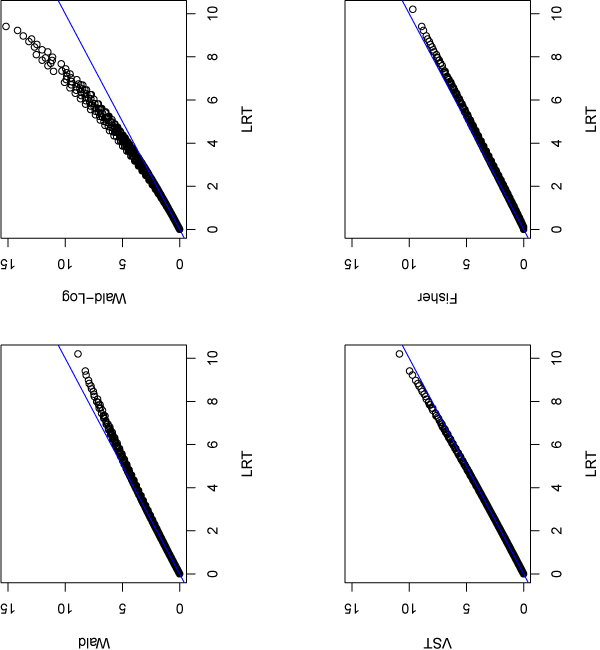
P-values of the 2657 low espression genes from different methods. Compare p-values (-log10 scale) obtained from other methods with those from LRT for the 2657 low expression genes whose average counts per lane are between 1 and 10 for each sample.