
Figure 5.
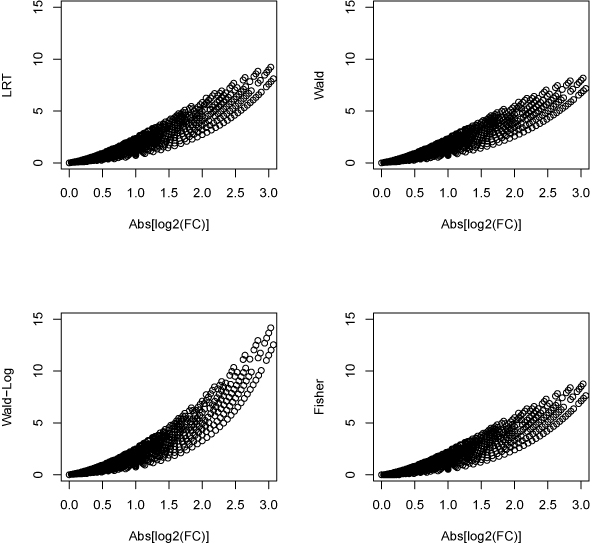
P-values vs. log2(FC) of the 2657 low espression genes from different methods. P-value (-log10 scale) obtained by various methods vs. fold change (log2 scale) for the 2657 low expression genes whose average counts per lane are between 1 and 10 for each sample.