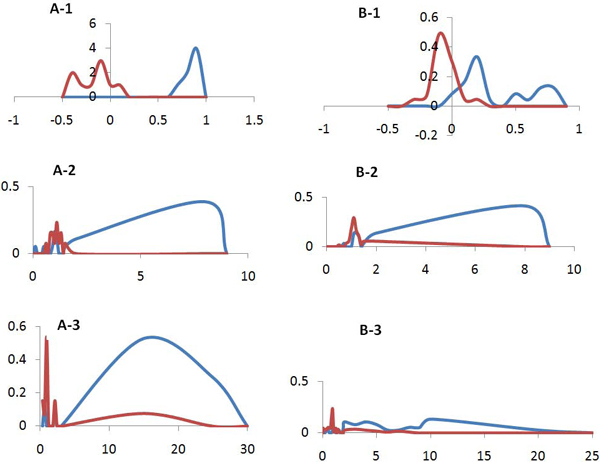
Figure 3.
Classification strength of each of three tree topological features. Part A of the figures is generated using 83 microbial species based on MSA (multiple sequence alignment) on 16S rRNA sequences. A-1 shows leaf rate topological feature generated per dichotomies and polytomies, while A-2 and A-3 use IntraR and InterR features, respectively. Part B of the figures is generated using all 398 microbial species based on composite distance calculation from ConPhy. B-1 shows leaf rate topological feature generated per dichotomies and polytomies, while B-2 and B-3 use IntraR and InterR features, respectively.

