Figure 6.

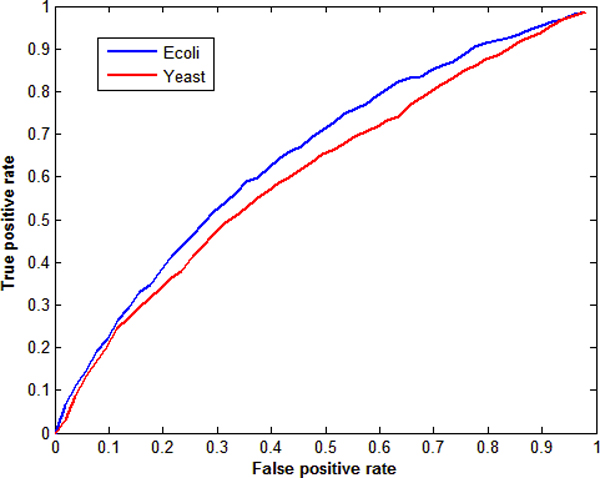
ROC curve for E. coli and yeast datasets with 50 genes by using SSM with 2 hidden variables. The false and true positive rates are averaged rates over 10 corresponding GRNs.

ROC curve for E. coli and yeast datasets with 50 genes by using SSM with 2 hidden variables. The false and true positive rates are averaged rates over 10 corresponding GRNs.