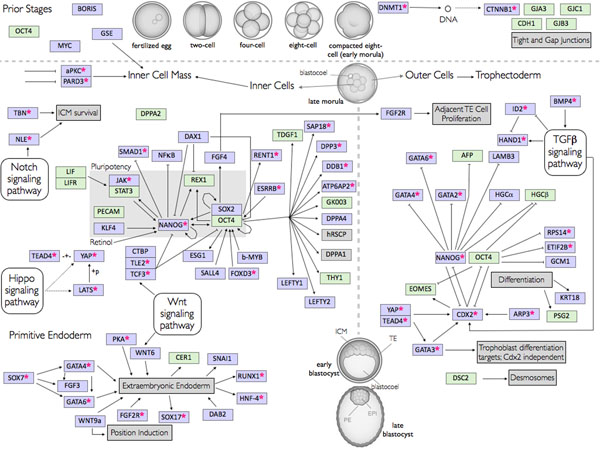
Figure 2.
Preimplantation development pathway. The figure shows a pathway representation of the genes involved in the regulation of the preimplantation development and interactions between them. Some functions are also detailed in the grey rectangles. In the upper part of the figure are located genes involved in the early stages of development (until blastocyst formation) below these, the left part corresponds to the regulations that occur in the inner cell mass, the portion of cells that remains undifferentiated during a longer period of time, part of these cells will give rise to the primitive endoderm and the genes that regulate this process are shown in the bottom left. In the right are the genes involved in the development of the outer cells of the blastocyst, which differentiate to form the trophectoderm. The interactions are described in the text. KEGG Markup Language was used for pathway representation. The developmental stages figures were adapted from Yamanaka et al. 2006 [14]. The pathway genes are represented according to their ancestry based on the determination of their Last Common Ancestor. Genes considered recent are shown in green while genes of more ancient origin are shown in lilac. Genes that present an ortholog in D. melanogaster are marked (*). This will be further adressed in the text section “Pathway Ancestry”. DPPA1 and hRSCP are shown in grey due to the fact that the lack of corresponding SwissProt annotated gene product to be used as seed prevented their use in this analysis.

