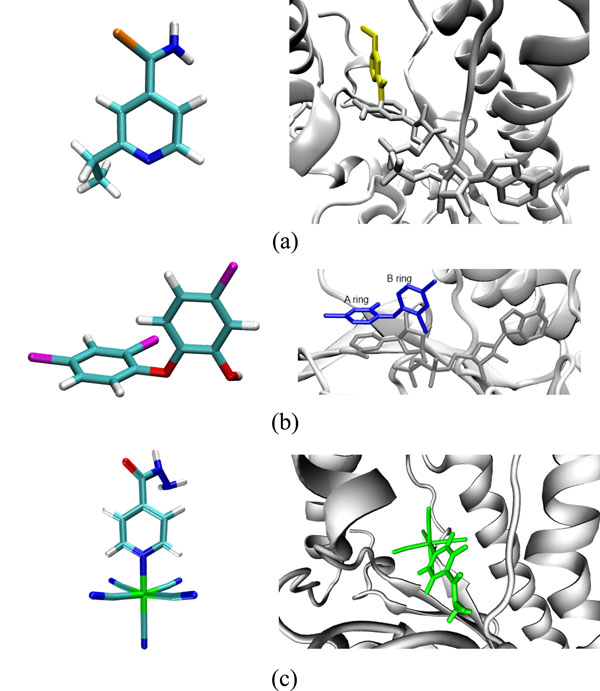
Figure 2.
The ligands. (A) On the left, stick model representation of the ETH ligand. The hydrogen, nitrogen, carbon, and sulphur atoms are colored white, dark blue, cyan, and light brown, respectively. In the right, stick model representation of the adduct ETH-NAD (PDB ID: 2H9I). Activated ETH is colored in yellow and NAD in metallic grey. The adduct binds to the InhA active site with ETH blocking part of the substrate binding cavity. (B) Stick model representation of the TCL ligand. The color scheme and receptor representation are the same as in (A), except for oxygen and chlorine which are colored red and magenta, respectively. Stick model representation of the π stacking interaction between TCL’s A ring (dark blue) and the nicotinamide ring of NADH (from PDB ID: 1P45). (C) Stick model representation of the PIF ligand. Here the iron atom is colored green. Stick model representation of one possible interaction between PIF (green) and the InhA enzyme. InhA main-chain is represented by ribbons.

