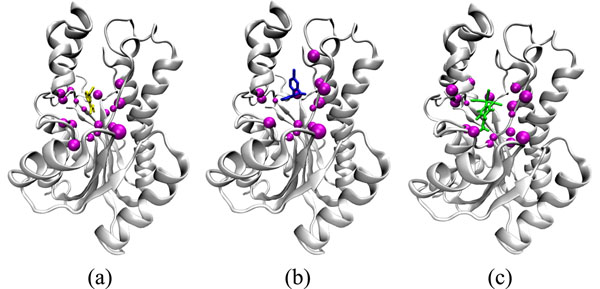
Figure 3.
Top amino acid residues in the receptor-ligand interactions. Representation of the top 19 and 18 amino acid residues in the receptor structure (PDB ID: 1ENY). The stick representation of ETH (a), TCL (b), and PIF (c) are colored yellow, dark blue, and green, respectively. The residues are represented as magenta beads. The InhA receptor main-chain is represented by ribbons.

