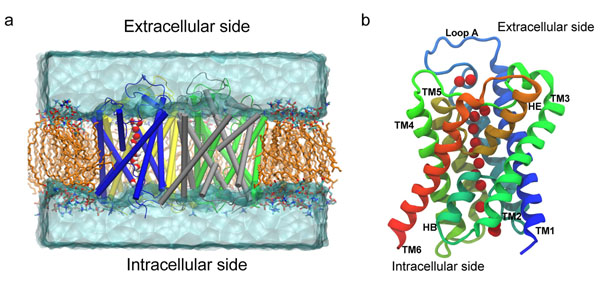
Figure 1.
The simulated system and the AqpM monomer. (a) Snapshot of the Simulated System. AqpM monomers are rendered in cartoon representation. Hydrogen atoms and some lipid molecules have been omitted for clarity. Aliphatic tails of lipid molecules = orange; Lipid headgroups are colored by element (red = oxygen, blue = nitrogen, cyan = carbon). Water molecules above and below the membrane are represented as a transparent solid surface. The single file of water molecules inside one AqpM monomer is shown as vdW spheres colored by element (red = oxygen, white = hydrogen). (b) Schematic representation of the AqpM monomer viewed parallel to the membrane plane. The six transmembrane (TM1-TM6) and two half-membrane (HB and HE) spanning helices are labeled. The red vdW spheres represent the oxygen atoms of the single file of water molecules inside the AqpM monomer.

