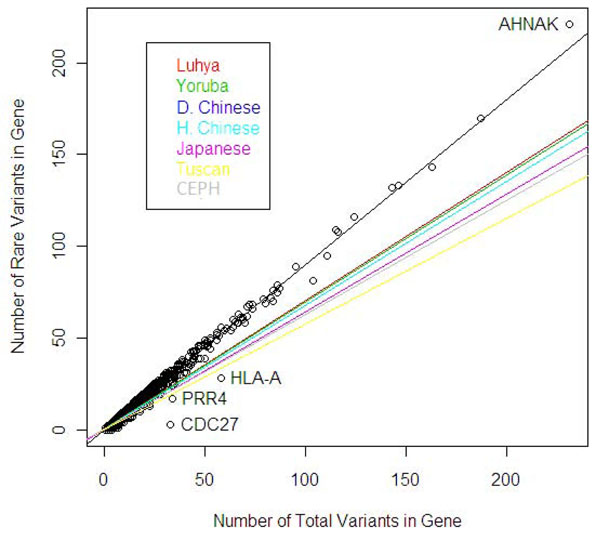
Figure 1.
Rare variant density for each population and all populations pooled using all available SNPs. The slope for the linear regression of rare variants on total variants per gene for all populations pooled is shown in black (each point represents an individual gene). The highlighted genes are those with the greatest difference between observed and predicted values. The slopes for the seven individual populations are shown in different colors. The Denver Chinese (D. Chinese) and Han Chinese (H. Chinese) are superimposed in such a way that only one line is observed for both slopes.

