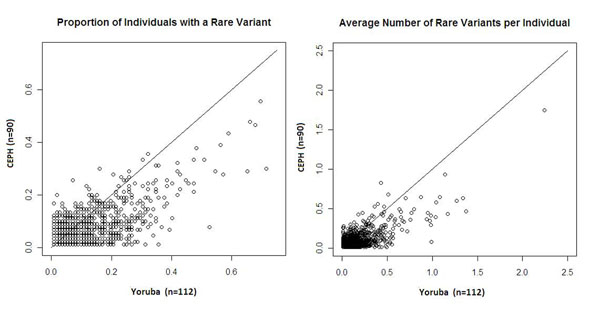
Figure 3.
Measures of rare variant density used in rare variant case-control association analysis. Comparison of the distribution of rare variants between the Yoruba and CEPH populations. Each point represents the value for one of the genes for both populations. The identity lines are plotted to aid in the comparison.

