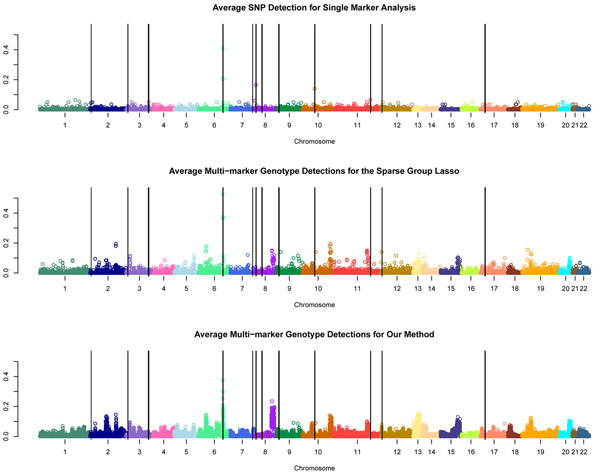
Figure 2.
Detection signals for three different methods. The three plots present the average detection rates for the single-marker analysis (top), the sparse group LASSO on multimarker genotypes middle), and our method (bottom) for each SNP or multimarker genotype. The p-value threshold (5 × 10⁻⁴) and penalty strengths (16.0 and 0.90, respectively) were chosen to give false-positive rates of about 0.005.

