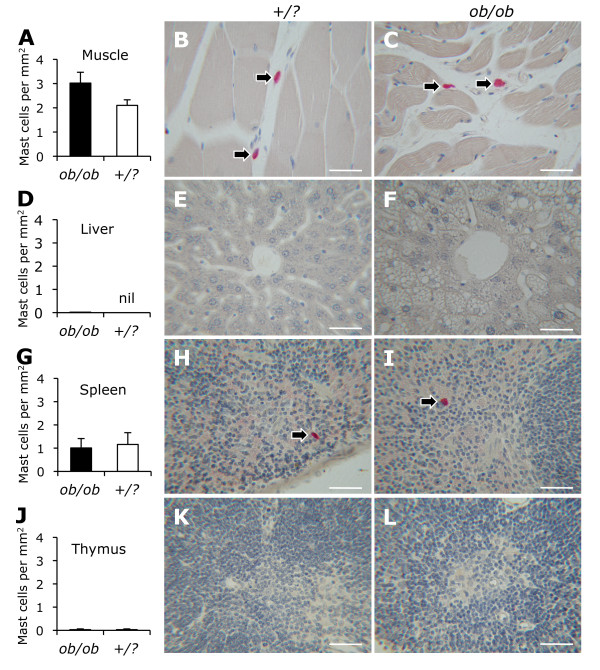
Figure 5.
Mast cells in skeletal muscle, liver, spleen, and thymus. The density of mast cells in gastrocnemius muscle (A-C), liver (D-F), spleen (G-I), and thymus (J-L) from ob/ob (n = 10, black bars) and control (+/?, n = 10, white bars) mice is shown. Photomicrograhs demonstrate mast cells (arrows) stained for chloroacetate esterase. Scale bars are 50 μm.

