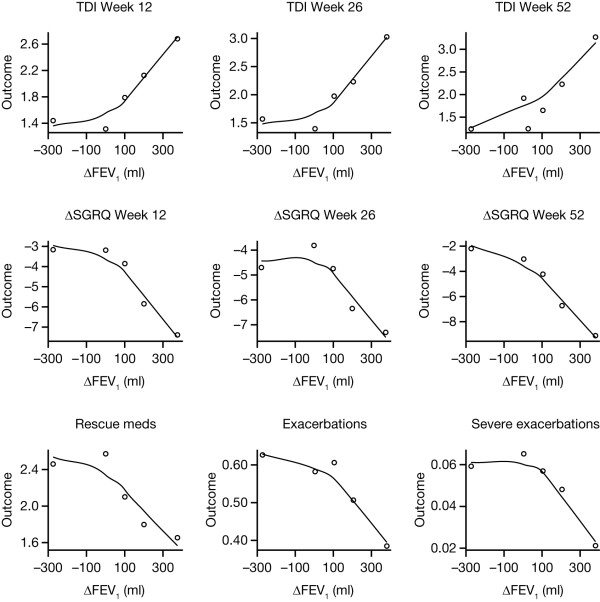
Figure 1.
Outcome means in ΔFEV1 categories versus category midpoint value. Plots show data with Loess smooth curves superimposed. ΔFEV1, change from baseline in trough forced expiratory volume in 1 second; TDI, Transition Dyspnoea Index; ΔSGRQ, change from baseline in St George's Respiratory Questionnaire.

