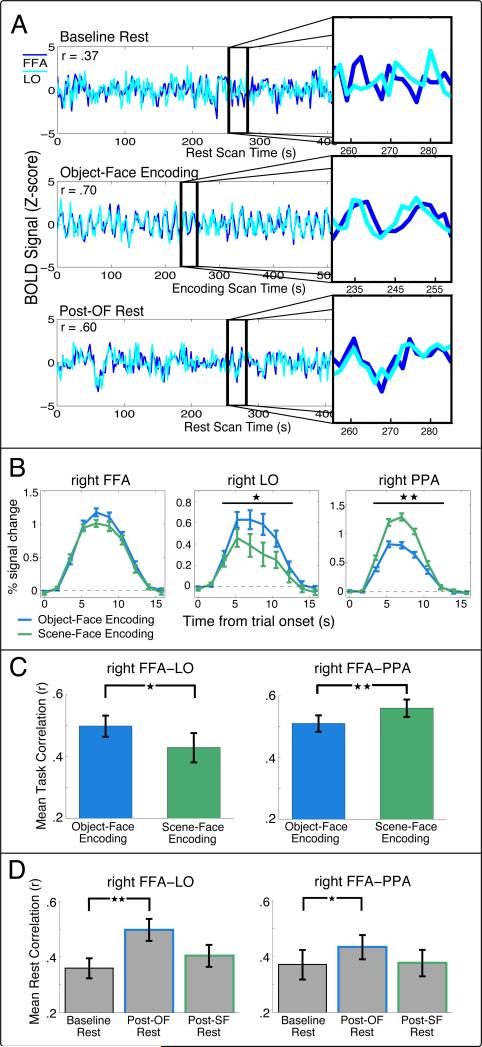
Figure 2. Cortical activity and correlations during Encoding tasks and Rest.
(A) Example time courses and analysis procedure for an ROI pair from a single subject. The BOLD time course is shown for the FFA and LO during Baseline Rest (top), Object-Face Encoding (middle), and Post-OF Rest (bottom). The insets show time courses from the two ROIs for 29.75 s and illustrate the pattern of non-zero correlations at baseline rest, task-evoked correlations during encoding, and enhanced correlations during rest following encoding. (B) Mean BOLD responses during Encoding tasks for localizer defined ROIs. The right FFA (left), LO (middle), and PPA (right) were significantly active above baseline during both Object-Face Encoding (FFA, t15 = 14.24, P < 10-9; LO, t13 = 5.25, P < .001; PPA, t15 = 11.85, P < 10-8) and Scene-Face Encoding tasks (FFA, t15 = 13.75, P < 10-9; LO, t13 = 2.94, P < .02; PPA, t15 = 15.98, P < 10-10). No significant difference in percent signal change was found between the Encoding tasks in the right FFA (t15 = 1.57, P > .13). The right LO was significantly more active during Object-Face versus Scene-Face Encoding (t13 = 3.17, ★P < .008), with the opposite pattern found for the right PPA (t15 = 6.45, ★★P < 10-4). Significance was evaluated by comparing the area under the curve for each Encoding task across subjects. (C) Mean correlations during Object-Face and Scene-Face Encoding tasks for the right FFA-LO (left) and the right FFA-PPA (right). Higher correlations between the FFA and LO were found for Object-Face versus Scene-Face Encoding (t13 = 2.37, ★P < .05) and higher correlations between the FFA and PPA were present for Scene-Face relative to Object-Face Encoding (t15 = 3.59, ★★P < .005). Note that all statistics were computed on Fisher Z-transformed correlation (r) values. (D) Mean correlations between the right FFA-LO (left) and right FFA-PPA (right) during baseline and post-task rest periods. Greater correlations were found across subjects for the Post-OF Rest compared to the Baseline Rest for both ROI pairs. No changes were found between the Baseline Rest and Post-SF Rest.

