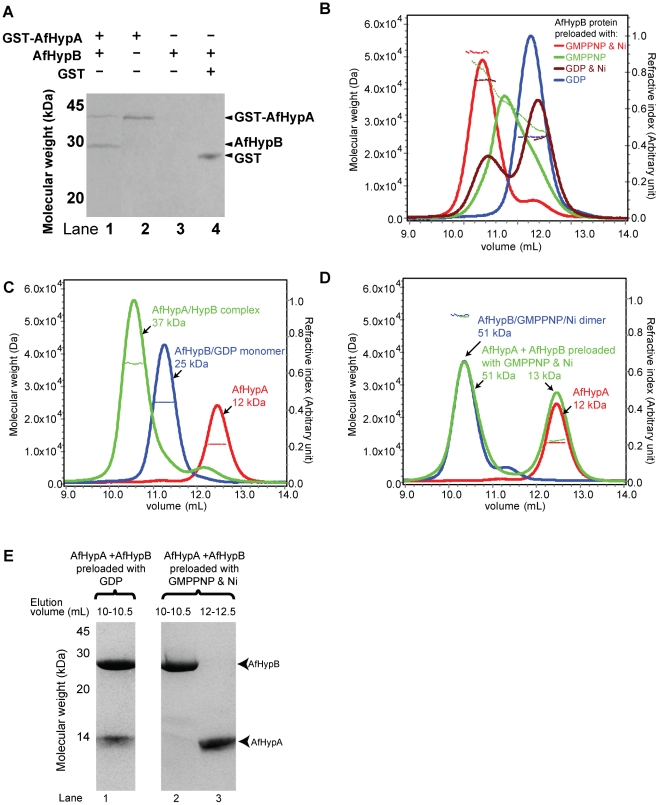
Figure 1. AfHypA and AfHypB form 1∶1 heterodimeric complex.
(A) Cell lysate containing GST-tagged AfHypA were loaded on to glutathione resin with (lane 1) or without (lane 2) AfHypB. After extensive washing, GST-AfHypA and AfHypB were co-eluted with 20 mM glutathione (lane 1). In contrast, no co-elution was observed in the resin (lane 3) and the GST (lane 4) controls. (B) Purified AfHypB dimer preloaded with various ligands were subjected to SEC/LS analysis. Refractive index (continuous lines) and molecular weight (dotted lines) were plotted in the chromatogram. AfHypB preloaded with both GMPPNP and Ni (red) was eluted as a major peak with observed molecular weigh 51 kDa. AfHypB preloaded with GMPPNP (green) showed a broadened peak with observed molecular weight ∼36 kDa. AfHypB preloaded with Ni (brown) showed two eluted peaks with observed molecular weight 42 kDa and 25 kDa. AfHypB preloaded with GDP (blue) was eluted as a monomer with observed molecular weight of 25 kDa. (C) Mixture of equimolar of AfHypA and AfHypB preloaded with GDP (green) was analyzed by SEC/LS. AfHypA and AfHypB were eluted as a complex of 37 kDa. Individual elution profiles of AfHypA (red) and AfHypB preloaded with GDP (blue) were included for comparison. The corresponding observed molecular weight of each peak was labeled in the chromatogram. (D) Similarly, mixture of equimolar of AfHypA and AfHypB preloaded with GMPPNP and Ni (green) was analyzed by SEC/LS. AfHypA and AfHypB were eluted separately in two peaks of molecular weight 51 kDa and 13 kDa. Individual elution profiles of AfHypA (red) and AfHypB preloaded with GMPPNP and Ni (blue) were plotted for comparison. (E) The eluted peaks of interest were analyzed by SDS-PAGE. AfHypB preloaded with GDP were co-eluted with AfHypA (lane 1), in contrast, AfHypB dimer preloaded with GMPPNP and Ni was eluted separately (lane 2 and 3).

