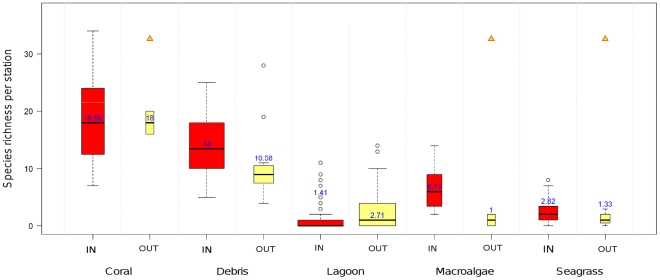
Figure 7. Species richness per station as a function of habitat (see Table 4 for habitat definition) and protection status (IN versus OUT).
On each boxplot, boxes showed the interquartile (0.25, 0.75) ranges; whiskers extended to the data point at ≤1.5 times the box length away from the box; values outside this range were represented by dots. Triangles indicated boxplots with less than 5 data.

