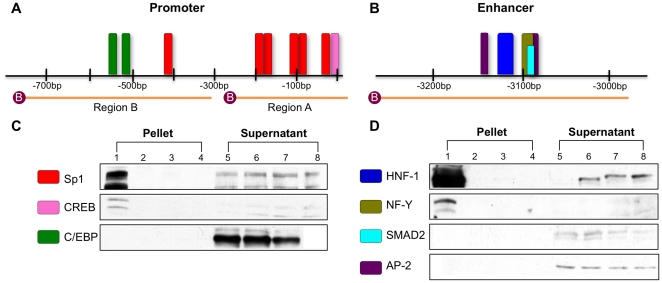
Figure 5. DNA-protein avidin-agarose pull-down assay results confirm transcription factor binding.
Two probes for the promoter (A) and one probe for the enhancer (B) encompass the highly conserved transcription factor binding motifs of NAGS. The motif colors reflect the colors used in figures 4A and B. Assays followed by immunoblot confirmed binding of Sp1 and CREB, but not C/EBP within the promoter (C) and HNF-1 and NF-Y, but not SMAD3 or AP-2 within the enhancer regions (D). Lanes 1–4 represent precipitated proteins from mouse liver nuclear extract bound to biotinylated probes of the regions of interest (Lane 1), non-biotinylated probes of the regions of interest (Lane 2), biotinylated probes of non-specific regions (Lane 3), and no probe (Lane 4). Lanes 5–8 represent supernatant fluid from overnight incubation of biotinylated probes of the region of interest (Lane 5), non-biotinylated probes of the region of interest (Lane 6), biotinylated probes of the non-specific regions (Lane 7), or no probe (Lane 8). Immunoblots are representative of at least three replicate experiments.

