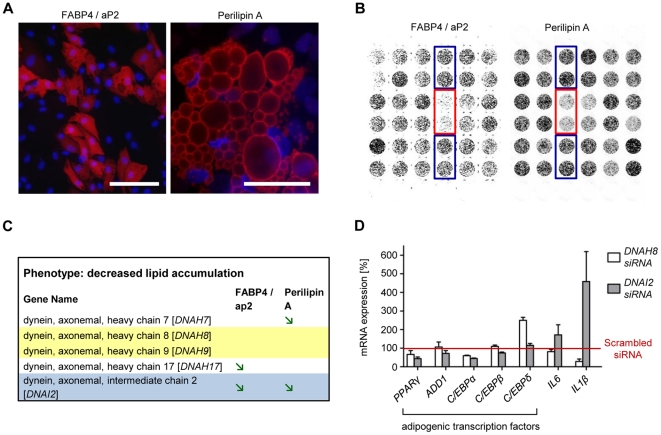
Figure 5. Knock-down of axonemal dyneins and classification of corresponding phenotypes.
InCell-Western Analyses were performed using aP2- and Perilipin-specifc antibodies. (A) Depicted are immunofluorescence images showing aP2 and Perilipin stainings. (B) InCell-Western-Image using aP2 and Perilipin antibodies showing PPARγ knock-down (rimmed in red) and scrambled siRNA edged in blue. (C) Classify of ‘target phenotypes’ into the following categories: (1) target-knock-down that reduce differentiation, [aP2 and Perilipin A signals decreased ≥20% compared to controls, green arrow]; (2) target-knock-down that stimulate differentiation [aP2 and Perilipin A signals increased ≥20% compared to controls, red arrow] and (3) target-knock-down that caused no changes in differentiation [no significant changes in aP2 and Perilipin signals]. For targets highlighted in grey, signals of both markers decreased or increased. For those targets under laid in yellow, none marker changed. (D) Messenger RNA levels of adipocyte-relevant transcription factors as well as IL6 and IL1ß after DNAI2- and DNAH8 knock-down. Differentiation was initiated 3 days after transfection. The qRT-PCR was performed on day 5 post-transfection. Results are depicted as mean ± SD.

