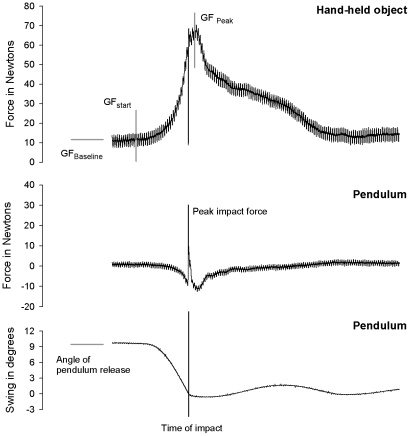
Figure 3. Motor performance measures.
This graph presents (top) the grip force (GF) adjustments recorded over the course of a single typical trial for a UHR patient. The two bottom graphs show the impact force applied on the pendulum head at the time of impact, and the variations in angle of pendulum swing, respectively, over the course of the same trial.

