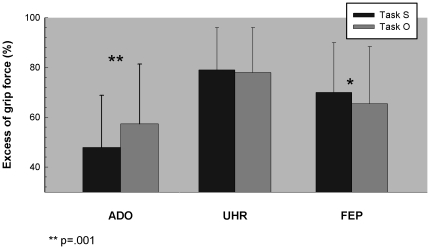
Figure 4. Motor agency perturbation in both clinical groups.
Graphic representation of the mean safety margin (SM in %) for the two experimental tasks (O: other-released task; S: self-released task), for the three experimental Groups: adolescent controls (ADO, N = 36); first-episode psychosis (FEP, N = 17); Ultra High Risk (UHR, N = 15).

