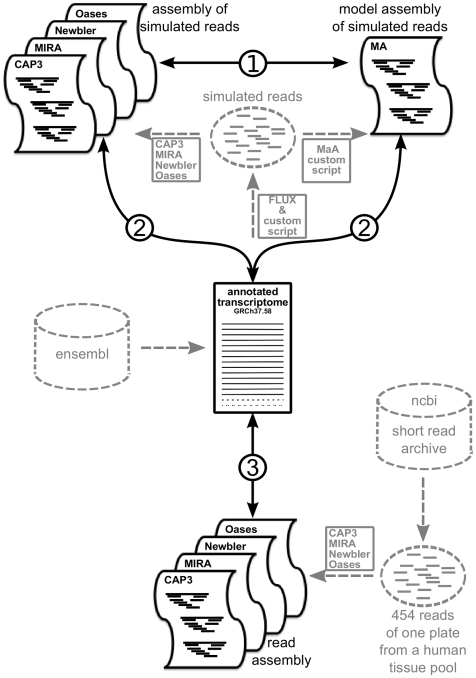
Figure 1. Workflow and comparison scheme for assembler evaluation.
Workflows are shown in grey, comparisons between data sets in black. To evaluate the performance of different assemblers three comparisons were performed: 1) Different assemblies of simulated reads were compared to a Model Assembly (MA), which was based on positional information. 2) Different assemblies of simulated reads were compared to a transcriptome annotation. The MA was compared in the same way to provide reference values for the evaluated measurements. 3) Different assemblies of real reads were compared to the transcriptome annotation to compare the simulation approach to values from a real data set.

