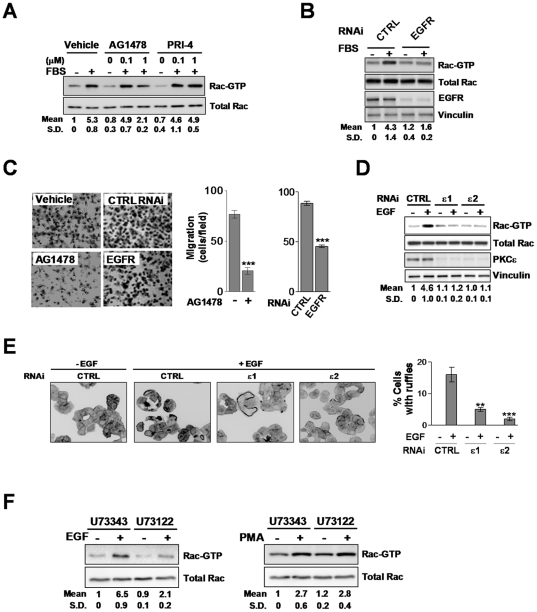
Figure 4. EGF-induced activation of Rac and Rac-mediated responses in A549 cells is mediated by PLC and PKCε.
A. Effect of AG1478 (0.1–1 µM) and PRI-4 (0.1–1 µM) on the activation of Rac by 10% FBS (2 min). A representative experiment is shown. Values indicate the fold-induction in Rac-GTP levels normalized to total Rac relative to levels at time = 0, as determined by densitometry. Data are expressed as mean ± S.D. (n = 3). B. Effect of EGFR depletion on the activation of Rac by 10% FBS (2 min).Values indicate the fold-induction in Rac-GTP levels normalized to total Rac at time = 0, as determined by densitometry. Data are expressed as mean ± S.D. (n = 3). C. Effect of AG1478 (1 µM) or EGFR RNAi on 10% FBS-induced A549 cell migration using a Boyden chamber (16 h). Left panels, representative micrographs. Right panel, quantification of 3 independent experiments. Data are expressed mean ± S.E.M. (n = 3). ***, p<0.001. D.A549 cells subject to either PKCε or control (CTRL) RNAi were serum starved for 24 h and stimulated with EGF (100 ng/ml, 2 min). Rac activation was determined with a pull-down assay. Data are expressed as mean ± S.D. (n = 3). E. Induction of ruffle formation by EGF (100 ng/ml, 15 min) in A549 cells subject to either PKCε or control (CTRL) RNAi. Left, representative micrographs are shown (n = 3). Right, quantification of cells bearing ruffles, expressed as mean ± S.D. of 3 individual experiments. ***, p<0.001. F. Effect of U73343 or U73122 (10 µM, 30 min) on Rac activation by either EGF (100 ng/ml) or PMA (100 nM, 2 min) in A549 cells. Values indicate the fold-induction in Rac-GTP levels normalized to total Rac at time = 0, as determined by densitometry. Data are expressed as mean ± S.D. (n = 3).

